CAPABILITIES
From a messy starting point to a useful answer.
Work visually when the next step is clear. Use SQL when the question needs more precision. Keep the path between data and understanding visible.
PRODUCT IN DEVELOPMENT
Metric Stone BI is being developed by Index Forward. The interfaces shown use synthetic data. Commercial availability, hosted access and public downloads have not been announced.
01 / PREPARE
Put the steps in order.
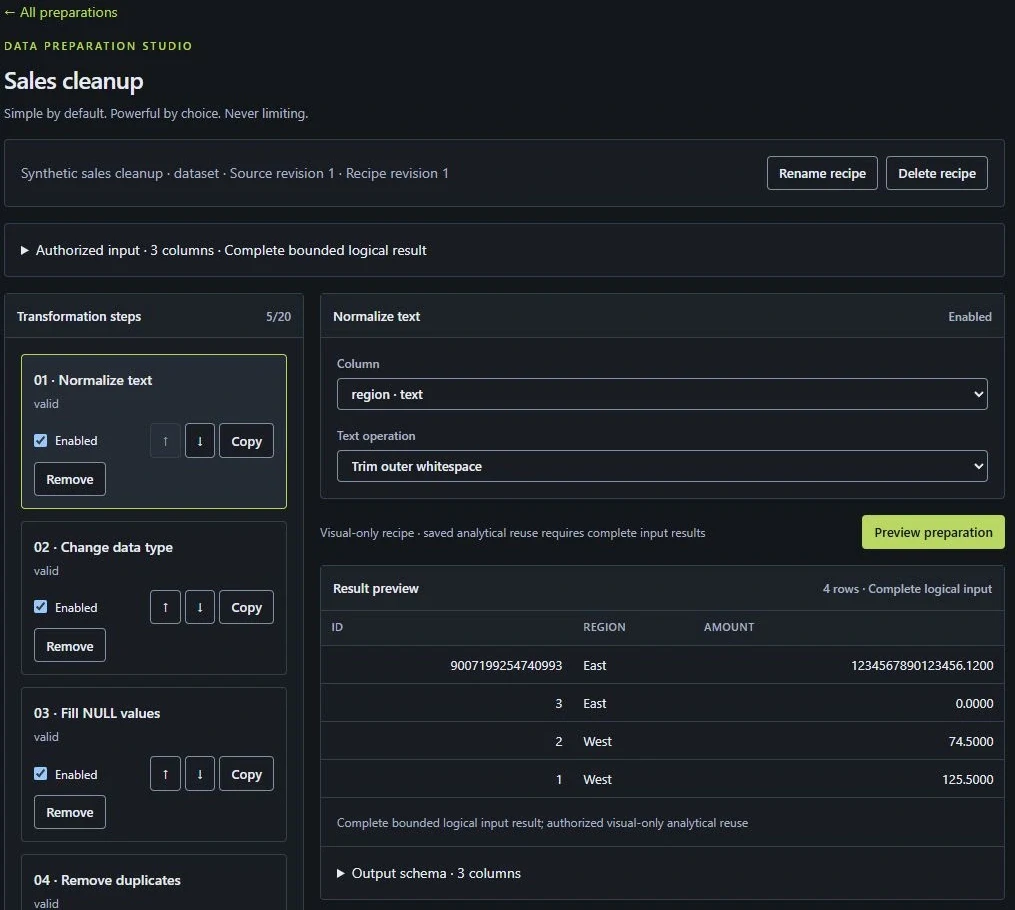
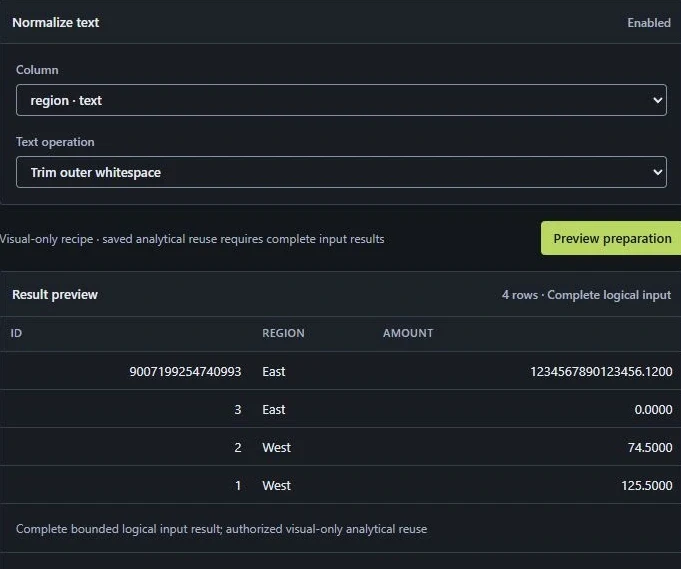
Build a visual recipe to select and reorder columns, normalize text, change types, fill NULL values, remove duplicates and sort rows. Preview deliberately, inspect the result and save a reusable recipe.
Analytical reuse requires a complete eligible input. This workflow does not import data or schedule jobs.
02 / EXPLORE & ANALYZE
Choose how you ask.
Reusable typed models.
Select fields, add finite numeric calculations and typed filters, then group and summarize an eligible file dataset. Saved definitions provide a consistent starting point for visualizations.
Current models operate over one eligible dataset; semantic relationships and reusable cross-model measures remain future work.
Governed SQL.
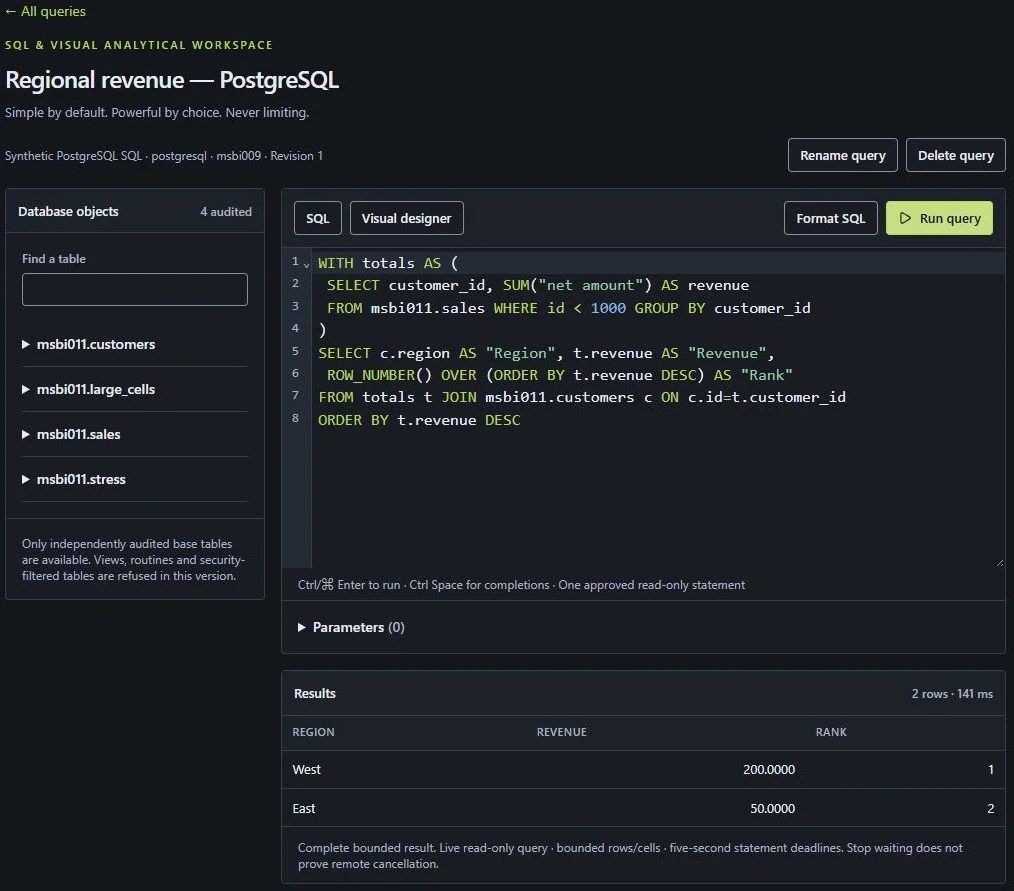
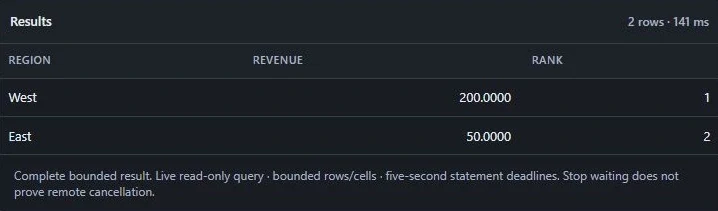
Inspect approved objects, write read-only SQL, define typed parameters and save a query. The Visual Query Designer supports bounded native relational workflows.
Browsing a connection and executing a query use separate permissions. Provider support and eligible operations differ.
03 / VISUALIZE & REVISIT
Keep the answer useful.
Saved visualizations.
Bar charts compare categories, line charts follow ordered trends and KPIs highlight a single complete value. Save a chart and add it directly to a dashboard.
Dashboards and filters.
Arrange saved charts in responsive dashboards. Explicitly mapped category and calendar-date filters support eligible model and native relational SQL tiles.
PDF and CSV.
Export authorized current dashboard results to static PDF or exact CSV. Incomplete or changed tiles refuse a misleading partial export; separate tiles are not an atomic snapshot.
04 / WORK WITH CONTEXT
Saved work respects current access.
Workspace, source and operation grants are enforced by the backend. Viewing and temporarily filtering a dashboard are distinct from managing its layout and saved defaults. Integrated, searchable documentation provides practical guidance and contextual help.
Production identity, public tenant administration, ordinary-user Python and full enforced isolation remain incomplete. These development capabilities are not a commercial security certification.
A CLEARER PERSPECTIVE
Start with the question that matters.
Explore how your data, analytical questions and working practices could fit Metric Stone.